Financial Analysis Software – Speed, Flexibility, and Accuracy
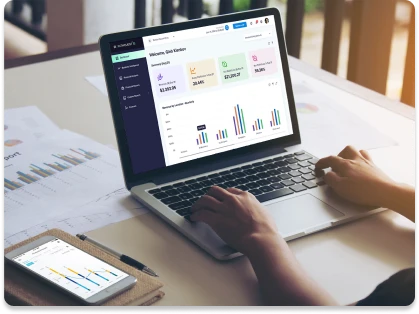
PathQuest BI is a financial analysis software that seamlessly analyzes and visualizes large, complex datasets. It swiftly constructs compelling visual narratives around financial efficiency, operational KPIs, business sustainability, and areas for improvement.
PathQuest BI transforms real-time financial data into actionable business insights, uncovering new growth opportunities, enhancing decision-making, and keeping your business at the forefront of innovation. It offers user-friendly revenue, expense, profit and loss analysis reports, as well as comprehensive management reporting and data visualizations. These tools empower you to gather financial business intelligence, conduct in-depth financial analysis, gain deeper business insights, improve efficiency, manage risks effectively, and make informed decisions.


Features that Translate Data into Intelligence
Track revenue, expenses, net profit & loss, and custom KPIs with a variety of charts and reports using PathQuest BI, going beyond the capabilities of other financial analysis software. It enables historical, current, and predictive representations of financials to facilitate informed decision-making. Additionally, it provides visibility into the financial situation and highlights improvement areas.
-
Consolidated Reporting
-
Secured Token Based Access
-
Industry Average Comparison
-
Improvement Opportunities
-
Business Forecasting
-
Customized Dashboard
-
Mobile Apps
-
Comparison of Budgeted Financials with Actual
Why PathQuest BI?
PathQuest BI seamlessly integrates with leading accounting software, providing advanced data visualization, management reporting, and unique business insights. With PathQuest BI, you can achieve better cash flow forecasting, conduct ratio analysis, perform benchmarking analysis, and create comprehensive financial budgets. Gain access to current and predictive insights into your business operations, empowering Chief Financial Officers (CFOs) and business owners to make well-informed decisions.
Furthermore, it keeps you informed about sudden business changes and offers financial control from anywhere and everywhere.
Take your accounting practice to the next level with PathQuest BI!
Financial Analysis Software to Empower Every Future Focused Business
We help you to TRANSFORM your real time financials into data driven insights, enabling you to draw the big picture. With PathQuest BI, harness the power of data and automation to accelerate business outcomes and plan ahead.
T
Tax & Accounting Firms
Take your practice to the next level with powerful advisory capabilities.
R
Restaurants
Gain valuable insight of the financial situation, accurately forecast and quickly respond to customer needs and local market trends
A
Auto Care
Powerful financial reporting, customized cash flow forecasting, and data-driven insights to improve the bottom line.
N
Not-for-Profit Organization
Always stay focused on your cause with real-time consolidated financial reports with custom dimension for clear understanding of cash flows.
S
Single & Multi Store Owners
Easy-to-understand data visualizations with striking business insights, enabling to draw bigger picture and stay updated on the most important business metrics.
F
Franchisees
Seamless consolidated reports for your multi-location business to identify key drivers and deliver value.
O
Onsite & Offsite Construction
Reduce business spending, make more accurate estimates, manage field operations, and track risk across projects.
R
Retail
Make informed decisions with data-driven insights on store performance, customer engagement, product merchandising, and inventory management.
M
Manufacturing & Distribution
Visualize and analyze data to gain improved insights into managing costs, operations, and profitability.
Easy Sync with Leading Accounting Software
Seamlessly integrate PathQuest BI with leading accounting software, such as QuickBooks, Xero, Sage Intacct, and MYOB, to ensure easy onboarding, stay connected, and get insights beyond financials.
What Our Customers Are Saying
Elevating Data Insights with PathQuest
Frequently Asked Questions
A Financial Analysis Software is a smart software designed to analyze and visualize complex financial data seamlessly. It creates comprehensive visual narratives around financial efficiency, operational KPIs, business sustainability, and areas for improvement. This software acts as a catalyst in transforming data-driven insights into actionable strategies, enabling businesses and accountants to stay ahead of the innovation curve and make well-informed decisions.
A Business Intelligence (BI) Software generally focuses on providing insights from various data sources to aid in overall business decision-making. On the other hand, a Financial Analysis Software, such as PathQuest BI, specializes in analyzing financial data specifically, helping to uncover opportunities, improve efficiency, and get current and predictive insights of business operations to ultimately make informed decisions.
A Financial Analysis Software, like PathQuest BI, enhances efficiency, aids risk management, and helps in making informed decisions. Key benefits include Consolidated Reporting, Secured Token Access, Industry Average Comparison, Improvement Insights, Business Forecasting, Custom Dashboards, Mobile Apps, and Budget vs. Actual Comparison—culminating in holistic financial understanding and strategic advantage.
Whether you’re a startup, a well-established corporation, advisory firm, accountant, or anything in between, if you handle financial data, this software can help you gain valuable insights. PathQuest BI benefits tax firms, restaurants, auto care franchises, NPOs, retail, manufacturing, distribution, and construction companies—enabling diverse industries to leverage financial insights for growth and informed decisions.
When evaluating a Financial Intelligence Software, consider features such as its data visualization capabilities, real-time data transformation, the ability to generate meaningful financial reports, support for various data sources, and user-friendly interface for ease of use. PathQuest BI offers seamless consolidation of clients’ data, on-the-go reporting via mobile app, real-time financial reporting across multiple locations or entities, effortless creation of customized dashboard, and the ability to gather raw transaction-level details.
While databases and data warehouses store information, a dedicated Financial Analysis Software, like PathQuest BI, specializes in transforming financial data into actionable insights. While data storage systems retain information, PathQuest BI refines data for simplified usage, accurate forecasting, and real-time insights. It translates complex financial data into actionable reports, equipping businesses with the tools to enhance decision-making, strategic planning, and overall operational efficiency.
A robust Financial Analysis Software quickly processes real-time financial data from databases, generating engaging insights for prompt decision-making. Professionals across finance, accounting, and business roles can access consolidated reports, spot trends, forecast, and evaluate KPIs. This drives growth, strengthens risk management, and improves strategic planning. Timely data-driven decisions, valued by CFOs and financial executives, become a competitive edge.
Certainly, PathQuest BI is designed to seamlessly integrate with widely used accounting systems, including Sage Intacct, MYOB, Xero, and QuickBooks. This integration facilitates the harmonious exchange of financial data, allowing for a comprehensive and consolidated view of your organization’s financial landscape.
PathQuest BI ensures data security by implementing a second layer of protection through token-based access. Administrators maintain meticulous control over actions and transactions, enhancing overall data protection when utilizing our Financial Analysis Software. It employs robust encryption and security measures to ensure your financial data remains confidential and protected from unauthorized access. Furthermore, PathQuest’s ISO 9001:2015 and ISO 27001:2013 certifications underscore its unwavering commitment to upholding data integrity and security.
The onboarding process is efficient and seamless. Upon initiation, you will receive user details and system access checklist. Our customer support team ensures custom setup, configuring data security permissions. Through 5 fundamental and 4 advanced training sessions, you will gain a comprehensive system understanding. Launch within weeks, leveraging the system’s prowess for swift, effective accounts payable optimization in just 2 to 3 weeks—not months.
Our Latest Thinking
Discover our informative and insightful resources to find a solution to your problems and stay up-to-date on the latest news, blogs, whitepapers, webinars, podcasts, and sample reports from our experts.



 Book a Demo
  Book a Demo


