Contents
Recently updated on December 4th, 2024 at 11:13 am
Isn’t it interesting to know that Costco, one of the leading retail companies based in Issaquah, WA, relies on financial analysis software to meticulously track its performance? From scrutinizing gross profit margin to evaluating operating profit margin, net profit margin, and liquidity ratios like current and quick ratios, Costco’s strategic decisions are grounded in the insights derived from financial analysis. This begs the question: In an era where retail giants harness the power of financial ratios, isn’t it crucial for every retail business to find out the potential of these intelligent solutions?
Well, if your answer to the above question is yes then let’s explore why it is important for multi-location retail franchises to get a consolidated rollup of all your financial ratios at a single glance.
Financial ratios provide retailers with valuable insights into the relationship between assets and liabilities, offering a gauge of inventory turnover and sales velocity. They play a crucial role in helping retail managers forecast cash flows by making informed predictions about the present and future. These ratios, acting as a financial compass, empower business owners to discern both the strengths and weaknesses of their enterprise. Embracing a culture of continuous reset is the need of the hour. By employing a well-crafted strategy, harnessing financial analysis, and maintaining a high level of agility, every retailer has the opportunity to reset, strengthen, and achieve sustainable growth. Keeping this in mind, we aspire to shed light on various types of financial ratios, unraveling their significance in the dynamic landscape of the retail industry.
Financial Ratios Every Retail Business Should Track
While many retailers grasp the basics of sales and profits, a deeper understanding is essential for informed decision-making. In the world of retail, the vitality of your last financial analysis defines your standing. Without recent checks, uncertainties loom: Is something missing? Are profits escalating, or is there a downturn? Identifying areas requiring attention becomes challenging.
Take, for instance, the special discount scenario discussed in our latest blog, where we talked about a multi-location retail franchise leveraging financial analysis software to assess KPIs such as net profit, gross profit, revenue, COGS, etc., in stores with special discounts, streamlining the evaluation of individual location performance in a jiffy, eliminating manual hassles. However, the silver lining is, you’re not alone in this puzzle. Tracking key financial ratios serves as a compass, offering insights into success or setbacks.
Profitability Ratios
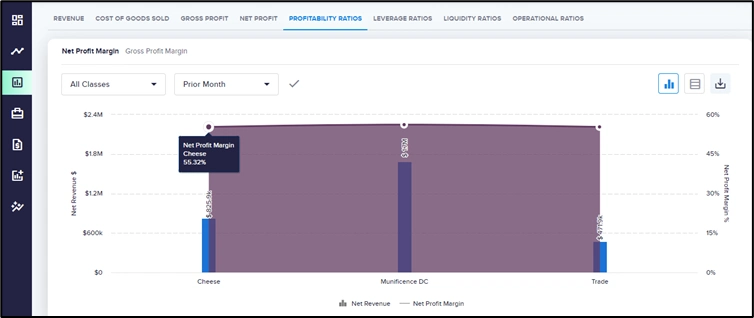
Profitability ratios, a crucial facet of financial analysis, offer multi-location retail franchises insights into the growth of their net worth beyond simple income generation and cash flow. Within the financial analysis software, two key categories of profitability ratios, namely net profit margin and gross profit margin, provide comprehensive perspectives. Retailers can access consolidated graphs and tables, offering a detailed transaction-level view based on critical parameters such as classes, entities, dimension, prior or current years, and months. This strategic analysis aids businesses in understanding the effective utilization of assets for growth, as exemplified by the return on assets (ROA) metric, calculated by dividing profit before taxes by net assets. ROA empowers retail businesses with various outlets to identify and address under-performing assets, contributing to informed decision-making about each location.

Leverage Ratios
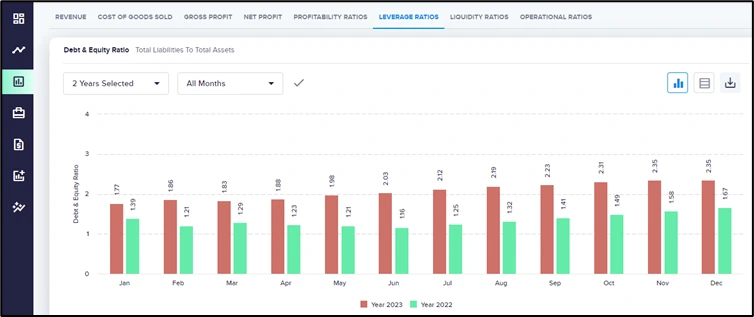
A leverage ratio in financial analysis serves as a metric revealing the extent of debt undertaken by a business entity relative to various accounts in its balance sheet, income statement, or cash flow statement. These ratios offer insights into how a company’s assets and business operations are funded—whether through debt or equity.
For multi-location retail franchises, this holds particular relevance. Consider the example of offering special discounts across various outlets which we discussed above. Now, the process of offering discounts inevitably involves financial considerations and potential impacts on the business’s financial structure. This is where leverage ratios become instrumental. Leverage ratios, such as the debt-to-equity ratio and total liabilities to total assets, play a vital role in assessing how the retail franchise is financing its operations during such promotional activities. For instance, if the business opts to take on more debt to fund the discounts, the leverage ratios will reflect this decision, offering valuable insights into the financial health of the enterprise during the promotional period.

Liquidity Ratios
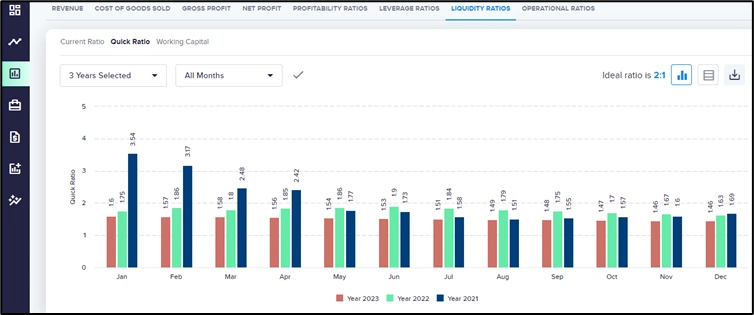
Ensuring a smooth cash flow is paramount for retail managers, and liquidity ratios are indispensable tools for achieving this. The current ratio, calculated by dividing current assets by current liabilities, is a vital metric that informs business owners about their ability to meet short-term obligations. For a more nuanced view of business solvency, the quick ratio considers only the most liquid assets by adding cash and accounts receivables, then dividing that figure by current liabilities. Financial analysis software simplifies the monitoring of liquidity ratios, offering a quick overview of current ratio, quick ratio, and working capital. This allows retailers to compare ratios across different timeframes, facilitating easy tracking and providing transaction-level details of current assets in a table format. Retailers can also download the in-depth report in excel or PDF form.
The insights derived from Liquidity Ratios are presented in both chart and table formats. You can conveniently view the data in chart form by selecting the highlighted icon, as depicted in the image below. The default viewing format for all Liquidity Ratios related reports is set to chart representation.

For a detailed examination, retailers can click on the Data Table icon to access the Liquidity Ratios report in a table format. This user-friendly interface enhances the ability to analyze and interpret liquidity metrics effectively.

Operational Ratios
The operational ratio, a crucial efficiency metric, evaluates day-to-day performance. In the context of a multi-location retail franchise, where every operational decision counts, the operating ratio becomes a key performance indicator. For retail owners, this ratio is a critical gauge of their ability to run operations efficiently, allocate resources wisely, and ultimately enhance profitability in a challenging market environment.
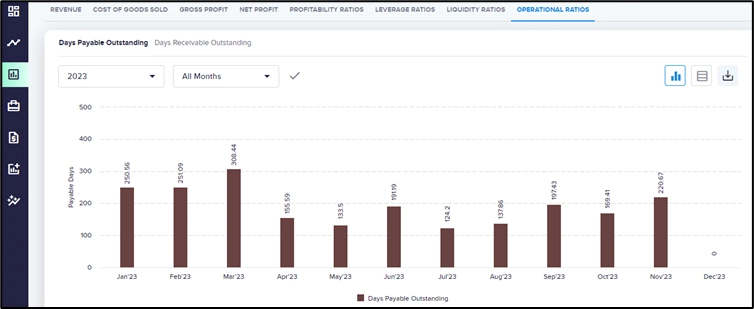
With the help of financial analysis software, retailers can further get insights into days payable outstanding and days receivable outstanding, essential components of operational ratios, at a single glance. This enables them to set parameters based on specific years and months, facilitating a granular examination of operational metrics. The added advantage of downloading data tables in various formats enhances the accessibility and utility of this critical operational information.

Ready to elevate your retail venture using the transformative force of financial ratios? Hope this blog offers the key insights required to reshape your business trajectory. Stay tuned for more tailored insights, designed for multi-location retail franchises, guiding you towards sustained growth in our ever-evolving market
Contact Us

Call Now:
+1 (743) 223-2073


