Contents
Recently updated on July 21st, 2025 at 08:42 am
Consumer preferences can change as rapidly as a trending hashtag on social media. This constant shift in trends can hamper the profitability of businesses. This is why staying ahead of these ever-changing trends and making well-informed, timely decisions is crucial to seize the opportunities at hand. Nowhere is this reality more evident than in the retail industry.
However, a majority of multi-location retail franchises still rely on manual methods, such as spreadsheet-based calculations, to conduct financial analysis.
This is precisely the reason why a significant number of retail businesses struggle to accurately gauge the financial performance of their operations, especially when managing a complex multi-location franchise. The challenges are manifold, from consolidating data from various locations to interpreting it effectively. But there is a solution, and within this blog, we are set to explore how retailers can conduct in-depth financial analysis using smart financial analysis software.
How Can Financial Analysis in Retail Supercharge Your Profits?
Let’s say you own a multi-location retail franchise, and you’ve decided to run special discount offers in some of your convenience stores. The promotions are a hit, drawing in a flurry of customers in most of the outlets. It’s an exciting time for your business. But how will you check each location performed? You’re running blind, not knowing the specific customer preferences and merchandise sales in each location, which can greatly impact your sales and revenue.
Don’t you think creating multiple spreadsheets and manually conducting financial analysis will feel like pulling your hair out? Now, let’s imagine you have smart financial analysis software in place. With just a few clicks, you can effortlessly check all the essential Key Performance Indicators (KPIs) and various parameters for each location. You can seamlessly conduct financial analysis without any guesswork and frantic spreadsheets.
Financial Key Performance Indicators to Measure Retail Success
In the vast and often complex retail industry, the importance of financial analysis to keep up with your finances cannot be overstated. With real-time access to essential key performance indicators (KPIs) such as revenue, COGS, net profit, and gross profit, you gain a clear map of your financial terrain. As you seek to evaluate the financial performance of locations where discounts were applied, let’s explore how these KPIs can be your guiding compass:
Revenue
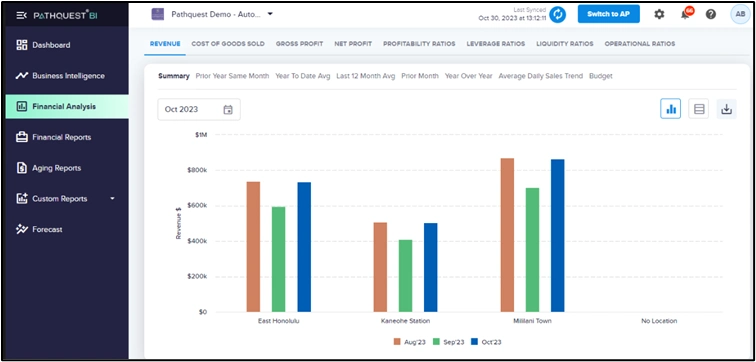
Revenue is one of the most important metrics. You can dive into the sales figures of the stores where you’ve introduced those special discounts, examining how each one fared. But how do you check the revenue and profits from each store? The old-school way would be to gather a stack of spreadsheets, one for each store, and start punching in numbers. You’d have to meticulously calculate how much money came in from each sale, what the costs were, and what’s left as profit. It’s a time-consuming, error-prone process, and you’re left in the dark about which products are shining and which aren’t. That’s where smart financial analysis software saves the day.
Financial analysis in retail is instrumental in transforming numbers into actionable insights. Through visually intuitive graphs and charts, retailers can explore revenue across multiple locations with ease. You can make comparisons across various timeframes, including the prior year, same month, year-to-date, last 12 months, prior month, and year-over-year performance.
Furthermore, the hyperlinked data functionality empowers users to drill down to transaction-level details without the need to access any external accounting system separately. This feature facilitates a granular examination of the performance of each location. Additionally, you can conveniently download charts and graphs in Excel or PDF format to share them among the team.

Cost of Goods Sold
Automated solutions to conduct financial analysis take the headache out of calculating COGS manually for each retail outlet. Financial analysis goes beyond mere cost summation; it excels in dissecting your expenses by class or department, mirroring the functionality of your dependable accounting systems. This feature allows you to pinpoint which specific areas are influencing your costs the most.
A noteworthy advantage? It doesn’t merely present figures in dollars; it translates costs into percentages for effortless comprehension. This breakdown sheds light on the intricate contributions of
each facet of your business to overall expenses. Imagine it as a magnifying glass for your expenditures, aiding in astute decisions on cost reductions or strategic investments for enhanced profitability.
While your competitors grapple with cumbersome spreadsheets, you effortlessly navigate through detailed insights, swiftly crafting strategic decisions. The efficiency gains provided by financial analysis software set you on a path to outpace the competition.

Gross Profit
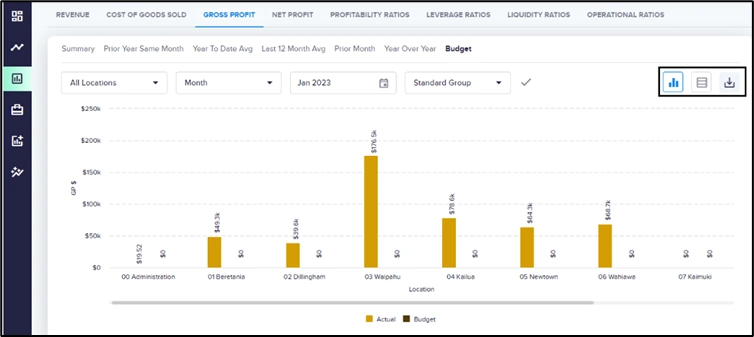
Understanding your business’s profitability is crucial, and gross profit margin is the key player in this game. It shows how much money your business makes for every sale, giving you a clear picture of its ability to turn a profit. A lower gross profit margin might signal potential losses due to higher costs, while a higher margin indicates a more lucrative business.
In the context of running special discount campaigns across multiple locations, financial analysis software makes calculating gross profit margin a breeze. It provides a visual representation of your profitability, enabling you to effortlessly steer your business towards informed and profitable decisions. While others struggle with manual calculations, you, equipped with a financial analysis system, can secure a profitable path for your business. It’s not just about numbers; it’s about making strategic decisions that elevate your business strategy right from the start.

Net Profit
Net profit stands as the barometer of a company’s financial health, representing the profit remaining after all expenses. Calculated by dividing net income by revenue, it’s the ultimate metric—the “bottom line” revealing profitability. A financial analysis tool seamlessly facilitates this by allowing retailers to compare net profit data, offering insights into decision-making. With a bird’s-eye view of net profit comparisons, multi-location retail franchises can gauge performance against averages, year-to-date figures, and budgeted targets, ensuring a robust strategy for financial success.

Key Takeaways
In this blog, we have explored how real-time financial analysis can supercharge your profits in the retail industry. By using smart financial analysis software, you can gain a clear map of your financial terrain and make well-informed, timely decisions.
Imagine the possibilities! With real-time financial analysis, you can see how your special discounts are performing in each location in real-time. You can see how much revenue each location is generating, how much each location is spending on COGS, and how much net profit each location is making. This
information can be used to make informed decisions about how to allocate your marketing budget, how to price your products, and how to manage your inventory.
In addition to the KPIs mentioned above, real-time financial analysis software also helps you to see:
- Financial ratios
- Financial and business reports
- Forecasts and predictive analysis
- Custom dashboards, and much more.
If you are looking for ways to take your retail business to the next level, harnessing the power of financial analysis is the key!
FAQS
Financial analysis in retail is the process of evaluating a retail business’s financial data to understand its performance, profitability, and stability. It involves reviewing key metrics like sales, expenses, profit margins, cash flow, and inventory turnover.
Real-time financial analysis is important for retail businesses because it helps them make faster, data-driven decisions. It allows retailers to:
- Quickly spot sales trends and adjust pricing or promotions
- Monitor cash flow and avoid liquidity issues
- Track inventory levels to prevent stockouts or overstocking
- React to market changes and customer demand in real time
- Improve budgeting and forecasting with up-to-date data
- Increase efficiency by identifying problem areas early
Overall, it helps retailers stay competitive, reduce risks, and boost profitability.
Most Important Retail Financial KPIs to Track:
- Gross Profit Margin – Measures profitability after cost of goods sold (COGS).
- Net Profit Margin – Shows overall profitability after all expenses.
- Sales per Square Foot – Indicates how efficiently store space is generating revenue.
- Inventory Turnover Ratio – Tracks how often inventory is sold and replaced.
- Sell-Through Rate – Percentage of inventory sold during a period.
- Average Transaction Value (ATV) – Average amount spent per customer transaction.
- Customer Retention Rate – Measures how well you keep customers over time.
- Cash Flow – Tracks the amount of cash moving in and out of the business.
- Return on Investment (ROI) – Evaluates the profitability of investments like marketing or new locations.
- Operating Expenses Ratio – Compares operating costs to total revenue to monitor efficiency.
Tracking these KPIs helps retailers manage profitability, efficiency, and growth.
Common Mistakes Retailers Make in Financial Analysis:
- Relying on outdated data – Using old or static reports can lead to poor decisions.
- Ignoring inventory metrics – Not analyzing stock turnover, shrinkage, or overstocking issues.
- Focusing only on sales, not profit – High sales don’t always mean high profits if margins are low.
- Lack of cash flow analysis – Overlooking cash flow can cause liquidity issues, even if sales are strong.
- Not segmenting data – Failing to analyze by product, store, or customer segment misses valuable insights.
- Manual data handling – Using spreadsheets increases the risk of errors and wastes time.
- Skipping forecasting – Not using historical data to predict trends or plan inventory and staffing.
Avoiding these mistakes helps retailers make smarter, data-driven decisions for growth and profitability.
How to Choose the Best Financial Analysis Tool for Retail:
- Retail-Specific Features – Look for tools that support inventory tracking, sales analysis, profit margins, and multi-location data.
- Integration – Ensure it integrates with your existing POS, ERP, and accounting software.
- Real-Time Reporting – Choose a tool that provides up-to-date dashboards and KPIs.
- Ease of Use – A user-friendly interface saves time and boosts adoption.
- Customization – Ability to create reports specific to your retail needs (e.g., category performance, store comparison).
- Scalability – Make sure it can grow with your business (more stores, SKUs, users).
- Support & Training – Check if the vendor offers training, onboarding, and customer support.
- Cost – Compare pricing plans and make sure it fits your budget.
Choose a tool that aligns with your current systems and offers the insights you need to make smarter retail decisions.
Yes, financial analysis tools can integrate with existing accounting software.
These integrations allow businesses to:
- Automatically sync financial data (like revenue, expenses, and cash flow)
- Generate real-time reports and dashboards
- Eliminate manual data entry and reduce errors
- Improve decision-making with up-to-date insights
Most modern tools offer integrations with platforms like QuickBooks, Xero, NetSuite, and others through built-in connectors or APIs.
Contact Us

Call Now:
+1 (743) 223-2073


