

Recently updated on January 18th, 2024 at 10:39 am
Let’s start with an interesting fact! Research undertaken by the Aberdeen Group discerned a 22% elevated adoption rate among users for companies employing interactive data visualization in contrast to those reliant on static reports. The surge in adoption is ascribed to the effortless and adaptable nature of engaging with data interactively using advanced financial analysis solutions.
It is no secret that smart and intuitive tools are having a huge impact on consumer goods or retail companies. However, to not just survive but thrive, multi-location retail franchises need more than intuition; they require insights backed by powerful data. Retailers are rapidly shifting to data visualization and analytics to create business value. To do more with data, leading retailers are using insightful dashboards to track their business progress and measure key performance indicators (KPIs).
Let’s explore how these dashboards revolutionize the retail game in this blog.
Unstructured to Structured Data with Retail Dashboards
A common struggle faced by retail business owners is the absence of a unified data hub, leading to limited access to diverse external data. This results in a critical insight gap, with 57% of finance executives pointing to a deficiency in data availability and access that hinders real-time, continuous accounting. In our recent blog about financial forecasts, we discussed the significance of the huge amount of data held by retailers in predicting cash flow, revenue, and more for the upcoming months or years. We discovered that this data can be invaluable if retailers do not use it optimally.
Often engrossed in labor-intensive tasks, retailers find themselves grappling with outdated data due to prolonged reconciliation and preparation times. Nevertheless, leveraging this wealth of information through insightful dashboards can elevate decision-making and strategic planning.
Act on Insights: Put Retail Dashboards to Work
Insightful financial dashboards transform unstructured data into intuitive graphs and charts, providing a full view of crucial KPIs on a single screen. To see this notion in practice, you need a robust financial intelligence solution where you can generate custom dashboards and gain a competitive advantage to thrive in the cutthroat retail environment. Check out how retail dashboards can enable you to spend less time on guesswork and more on business growth.
Standard Dashboard
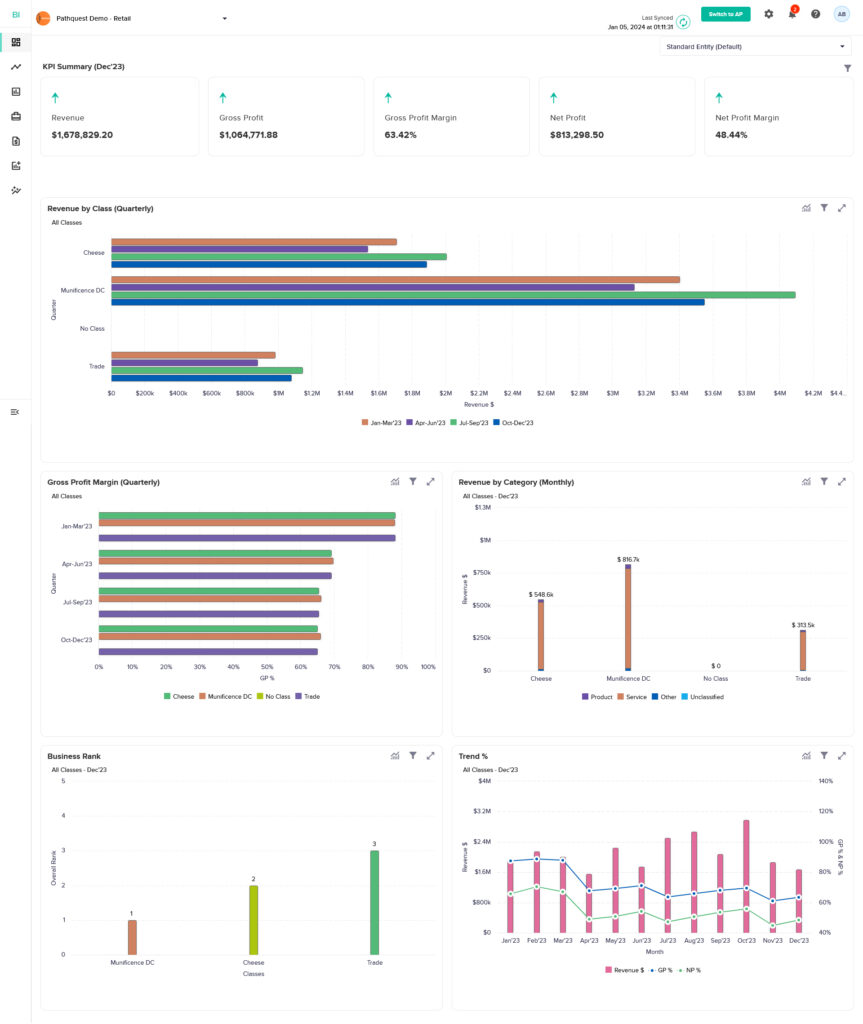
A standard retail dashboard is like the control panel for your business. It takes all your critical data—revenue, gross profit, net profit, trends, business rank—and presents it in clear graphs, both in dollars and percentages. The stakeholders involved can drill down the information for a clear and detailed view of operations to get real-time insights based on KPIs and key metrics. It’s not just numbers; it’s a deep dive into your financial performance.
This dashboard lets you dissect revenue by location quarterly, essential for staying informed. For multi-location retail businesses, track gross profit margin by quarter, with specific location filters. Dig into revenue by category, tailor-made for different industries or brands, giving your data a personalized touch.
Business Rank allows you to compare each location’s performance against similar brands or industries, offering a competitive advantage. The Trend % widget is your performance trend at a glance, combining revenue, gross profit %, and net profit %.
But wait, there’s more. Explore standard retail dashboards for valuable insights into cost and expense management, ensuring your business is not just running but running smart.
Custom Dashboard: Create Live Dashboards Using BI Solution
Custom dashboards take the standard dashboard to a whole new level. Imagine having a dashboard tailored precisely to your business needs, like a bespoke suit designed just for you. These dashboards allow you to pick and choose the KPIs that matter most to your business. For instance, in a retail setup, you can categorize areas like Apparel and Accessories, Electronics, Home and Garden, Health and Beauty, Toys and Games, Food and Groceries, Books and Media, Sports and Fitness, Stationery, and more. It’s a tailored approach to understanding how each segment performs, giving you the power to compare and optimize to make informed decisions.
Set filters across parameters such as location (multiple retail outlets), product, services, etc. Want a deep dive into KPIs, revenue trends, gross profit, net profit, cost of goods sold (COGS), operating expense, trends, and more? You got it. You can even customize the look and feel of the dashboard by selecting the types of graphs that you want to see for a particular KPI.
Daily Flash Report
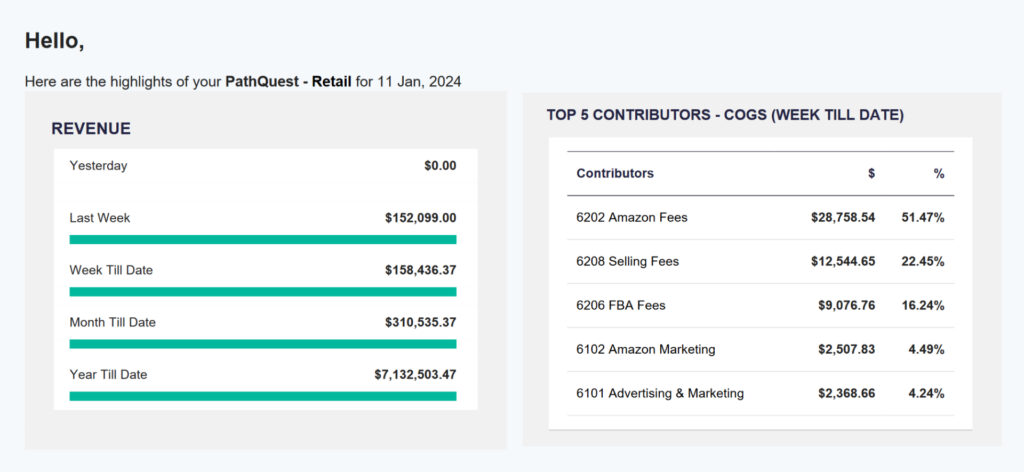
Introducing the Daily Flash Report – your real-time business informant. Imagine waking up each day to a tailored report summarizing your retail business’s crucial insights across all locations. This auto-generated gem is more than just a report; it’s your daily dose of business health. Trigger it at your chosen time – daily, weekly, monthly – and customize it to match your preferences. Set timelines and receive notifications when you want – ensuring you’re always in the know.
There’s no cap on the number of stakeholders you can share this insightful report with. Whether it’s your team, investors, or partners, everyone can stay in the loop effortlessly. For a multi-location retail business owner, it’s like having a personal briefing delivered straight to your inbox every day.
Next Steps: Change Isn’t that Daunting
Embrace the insights gained, explore the possibilities offered by financial intelligence solutions, and revolutionize the way your retail business operates. As we bid farewell to this series, remember, the journey doesn’t end here – it’s an ongoing exploration of the dynamic intersection between retail, data, and intelligence. The future is bright, and it’s yours to claim.
Stay informed. Stay ahead. Shape your retail future!
Published on: 2 January 2024

John Bugh is Chief Revenue Officer for PathQuest, responsible for the strategic direction, planning, vision, growth, and performance of the company’s marketing, branding, and revenue streams.
As a seasoned professional with over 35 years of experience in executive sales, marketing, and operational leadership, John has worked to build high-performing leadership-teams that have a demonstrated track record of accelerating growth, increasing revenue, establishing sustainability, and improving profitability.
Listen Exclusive Podcast On


Contact Us
Call Now:
+1 (743) 223-2073

