Contents
Recently updated on December 4th, 2024 at 09:26 am
Have you ever felt like you spent more time under the hood of your finances than you do under the hood of your car? Well, been there, done that! Handling customers, components, repairs, and attempting to understand your financial accounts on top of it all can drive you insane.
The amount of data generated by labor costs, client bills, parts costs, and overhead can be tiresome. Furthermore, the time you could be spending on servicing vehicles and satisfying customers is lost when manually analyzing numbers.
Want to escape the headache you get from hunching over calculators late at night and from endless spreadsheets? Let’s explore how.
Financial Analysis Software: Your Financial Pit Crew
Thankfully, the days of financial analysis drudgery are numbered. Financial analysis software acts as your personal pit crew, providing you with the tools and insights you need to get a clear picture of your auto care shop’s financial performance.
The financial analysis module is the heart of this system, breaking down your finances into key performance indicators such as revenue, net profit, gross profit, Cost of Goods Sold (COGS), financial ratios, and more, that are easy to understand and incredibly useful for maximizing your shop’s profitability. Let’s dive into some of these KPIs and see how they can help you troubleshoot your financial woes:
Revenue

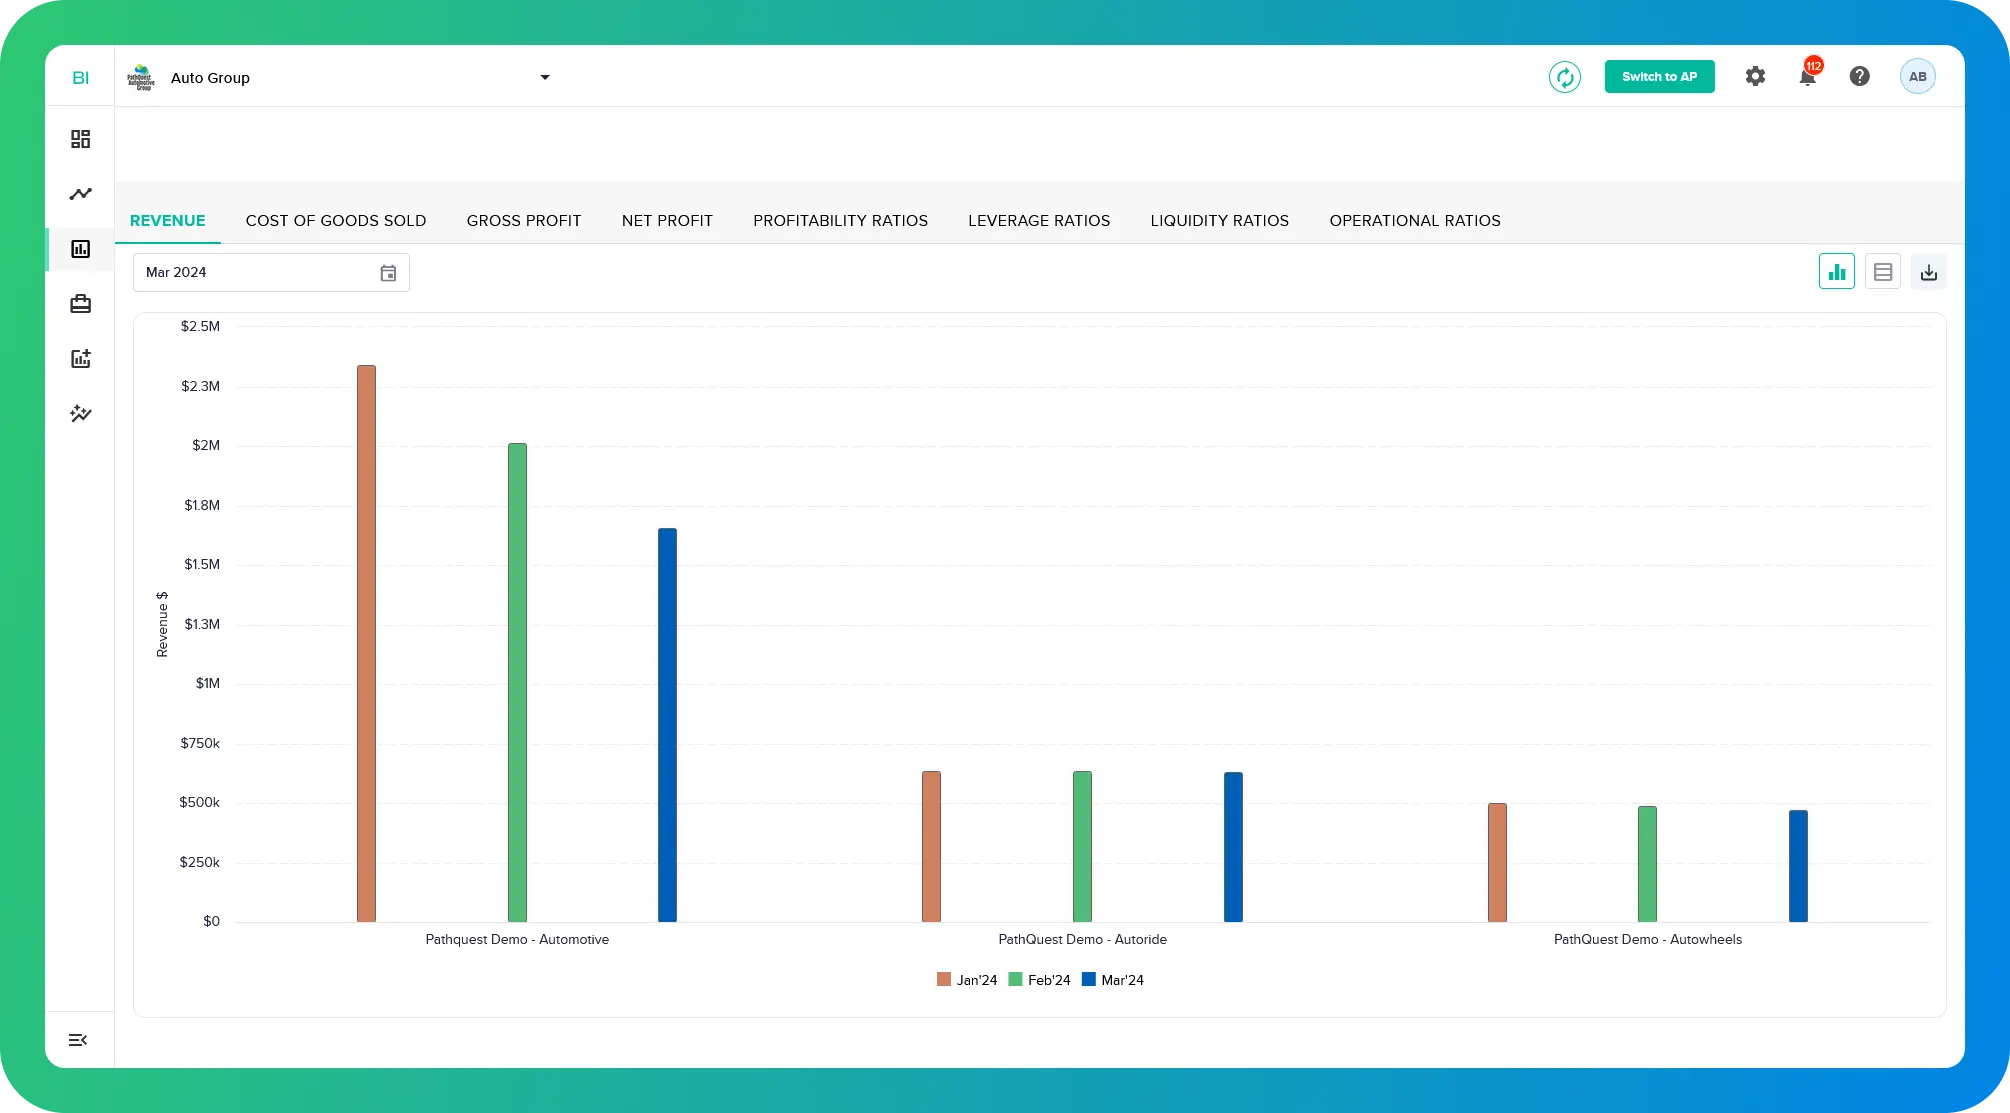
The revenue metric reveals your total income from repairs, parts sales, and additional services across various locations if you have multiple auto care shops. Financial analysis goes a step further – it can categorize revenue by service type. This allows you to identify your most profitable offerings and pinpoint areas where you might need to adjust your pricing or marketing strategies. For instance, a shop owner might discover that engine repairs are significantly more profitable than oil changes. This information can be used to prioritize engine repair services and potentially revise pricing for oil changes to ensure better margins.
Financial analysis software uses intuitive graphs and charts to paint a clear picture of your revenue across various timeframes (year-over-year, prior month, etc.). This allows for effortless comparisons and trend identification. Dive deeper with hyperlinked data which drill down to transaction-level details without switching between systems. This empowers you to examine the performance of individual services or parts with ease.
Cost of Goods Sold

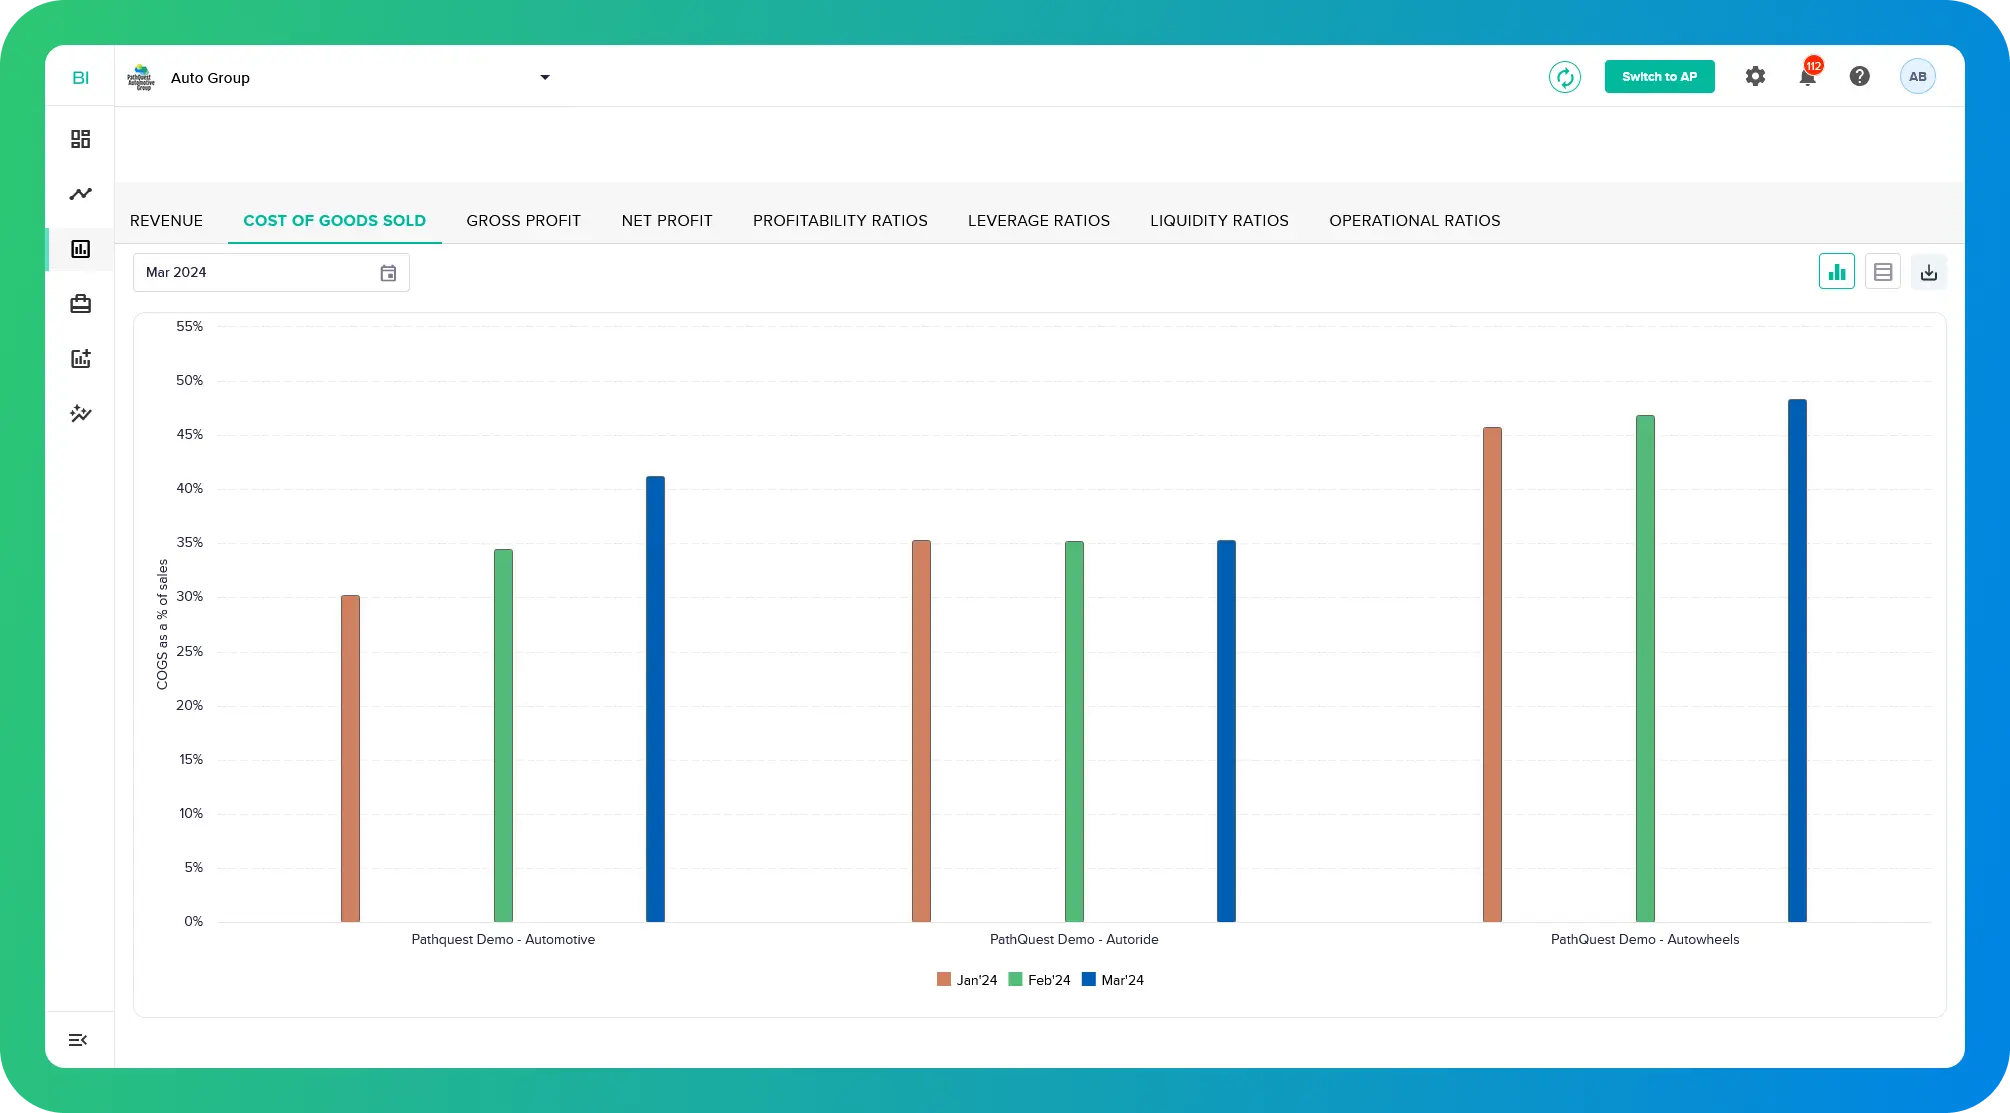
Think of this as the cost of the parts and materials used to get those cars running again. Financial analysis tracks COGS by category (engine parts, brakes, fluids) and even by specific part. This allows you to identify areas where you might be able to negotiate better deals with suppliers or optimize your inventory management. Essentially, it equips you with the insights to reduce unnecessary expenses and potentially negotiate lower costs with vendors.
Financial analysis software streamlines COGS calculations, eliminating manual effort and ensuring accuracy. Beyond basic cost summation, it excels at dissecting your expenses by category, mirroring the functionality of your accounting system. Furthermore, the software translates dollars into percentages. This empowers you to readily understand the contribution of each expense category to your bottom line.
Gross Profit

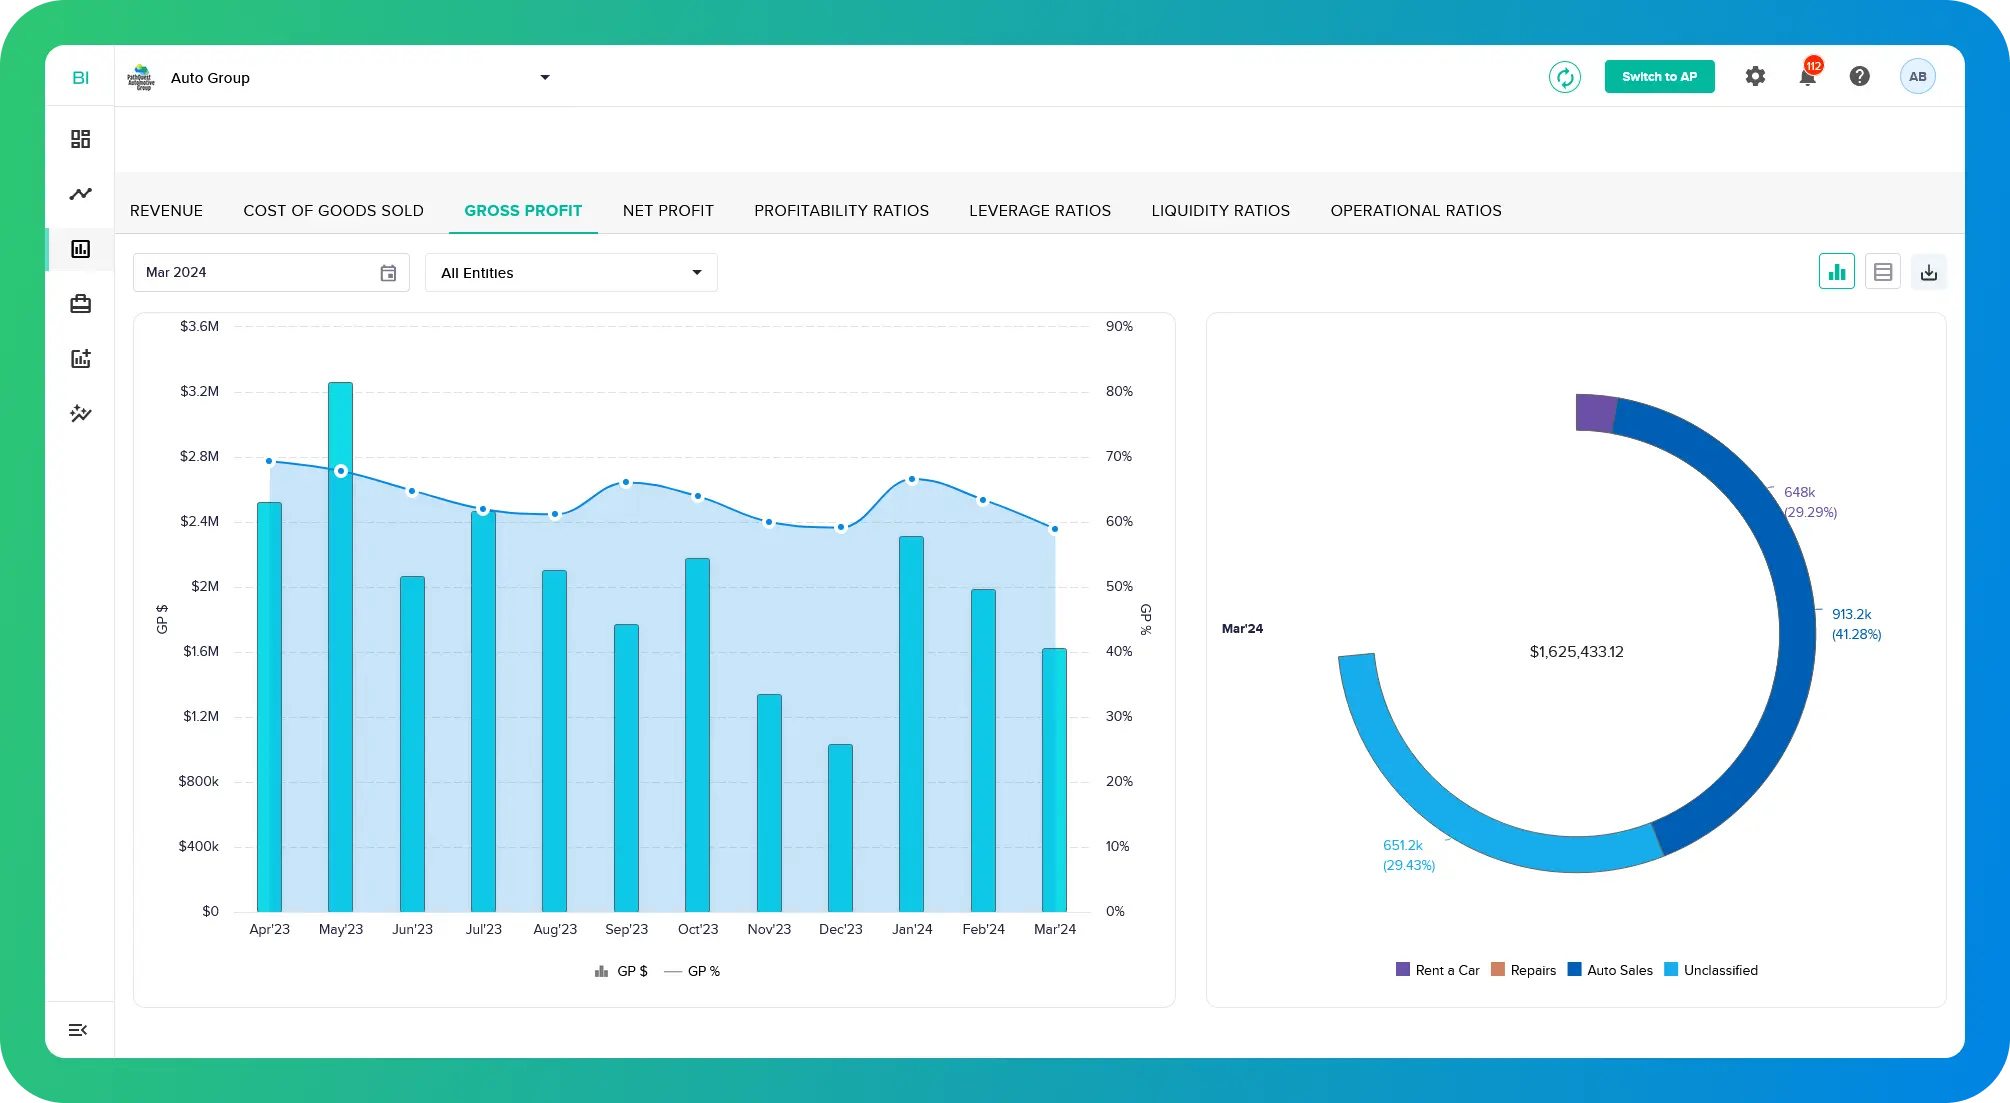
Gross Profit reveals the difference between your revenue and your COGS, essentially showing you how much money you have left after accounting for the direct costs of repairs. Financial analysis software allows you to monitor your gross profit margin over time and identify trends. A declining gross profit margin could indicate a need to adjust your pricing strategy or find ways to reduce COGS. It essentially acts as a financial red flag, prompting you to investigate potential issues with pricing or cost management.
Net Profit

This represents your shop’s true bottom line – the money remaining after accounting for all expenses, including rent, salaries, utilities, taxes, and more. Financial analysis simplifies this calculation and facilitates insightful comparisons. Imagine effortlessly comparing your net profit against industry, group, or brand, year-to-date figures, or budgeted targets. This empowers you to gauge your shop’s performance and make data-driven decisions that propel you towards long-term financial success.
Financial Ratios
The financial analysis module doesn’t just give you raw numbers; it also provides valuable insights through financial ratios. These ratios help you compare different aspects of your shop’s financial performance and identify areas for improvement. Here are a few key ratios for auto repair shops:
-
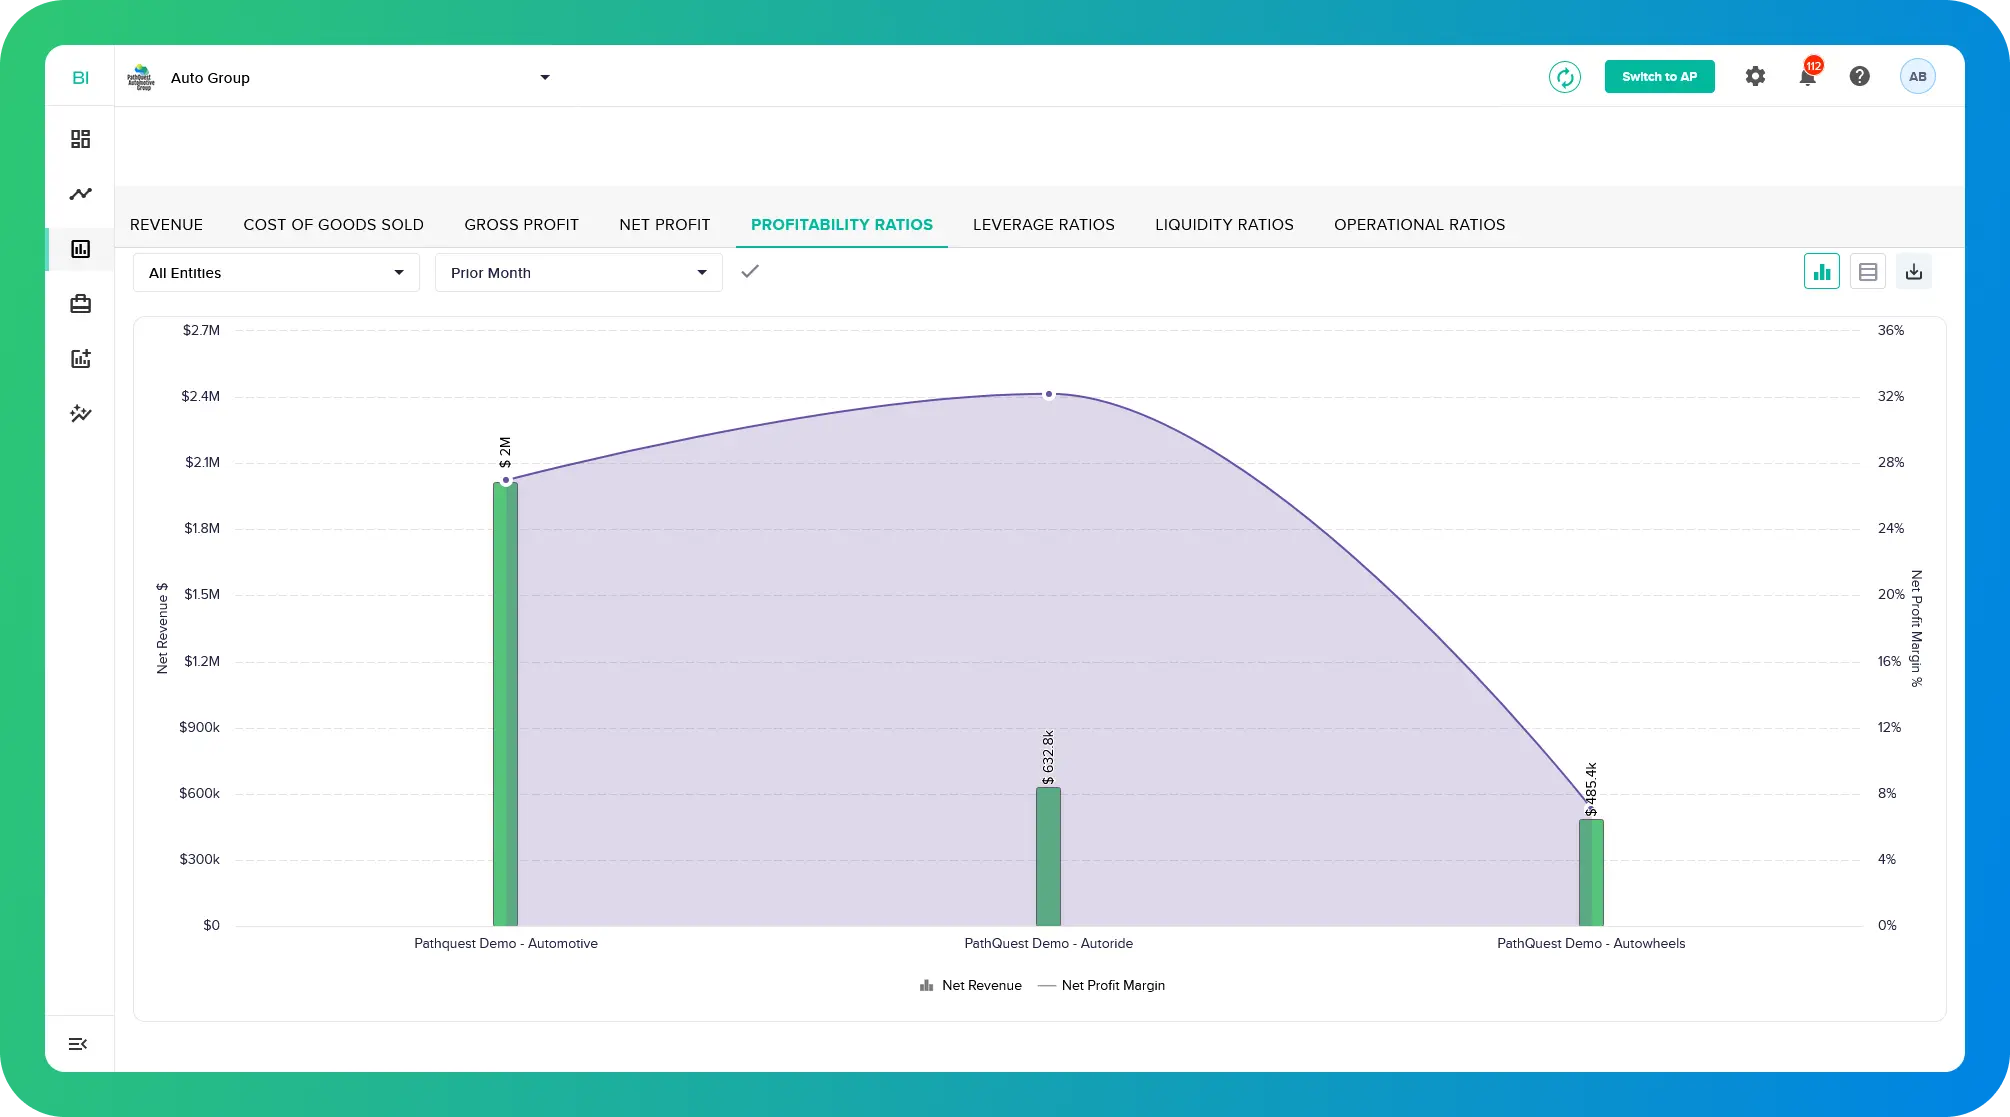
- Profitability Ratios: These ratios, like gross profit margin and net profit margin, tell you how efficiently your shop is converting revenue into profit.
-
- Leverage Ratios: These ratios measure your shop’s debt levels and your ability to meet those debt obligations.
-
- Liquidity Ratios: Financial analysis simplifies the monitoring of liquidity ratios, offering a quick overview of current ratio, quick ratio, and working capital. This allows auto care owners to compare ratios across different timeframes, facilitating easy tracking and providing transaction-level details of current assets in a table format.
-
- Operational Ratios: With the help of financial analysis, you can get insights into accounts payable outstanding and accounts receivable outstanding, essential components of operational ratios, at a single glance.

By analyzing these ratios, you can gain valuable insights into the overall health of your business.
Financial analysis empowers you to take control of your finances and shift your shop into profitability gear. It’s time to stop the wrenching on your finances and focus on what you do best – keeping those cars purring! Don’t wait – take a test drive of financial analysis software today and see the difference it can make in your business.
Contact Us

Call Now:
+1 (743) 223-2073


