Contents
Recently updated on December 4th, 2024 at 09:44 am
How to Customize an Accounting Dashboard to Maximize Effectiveness
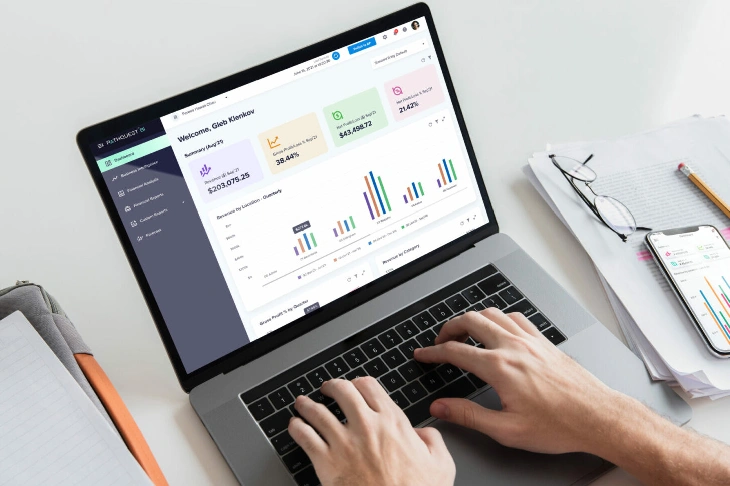
In some ways, an accounting dashboard is similar to the dash in your car. It provides a ton of information and someone can use it to figure out how their business “vehicle” is running. The biggest difference is that, unlike most car dashboard systems, you can customize your accounting dashboard to suit the needs of clients. This can be an effective tool for differentiating your accounting advisory services from those of the competition. Here’s how to use the dashboard function in accounting business intelligence software to maximize the services you provide to clients.
Establish Goals During Your Discovery Meeting
As you first get to know a client and their business model, your accounting dashboard can be the third leg of the stool—providing a more stable base for your business relationship. You can show your client the various metrics you can track on the dashboard and then discuss which ones would most effectively support their business.
For example, a chain of hardware stores may have concerns about managing how much they spend on inventory in relation to what they charge customers. During the discovery meeting, you can identify this as a primary metric to monitor and even set up benchmarks to keep an eye on. As you craft your accounting dashboard, you can put this metric front and center. This way, the client knows they can always reach out to get info about whichever metrics the two of you decided to highlight.
Customize the Dashboard According to the Organization’s Goals
Once an organization realizes the potential an accounting dashboard puts at your fingertips, it may want to use it as a way to add data-based insights to its goal-setting and -achievement process. Using your accounting data analytics software, you can help guide them through the facets of the dashboard that can help them get where they need to be over a certain period of time.
For instance, suppose a software development company is implementing an extensive hybrid work policy, hoping to both increase employee satisfaction and reduce energy costs. You can hone in on the goal of reducing their energy expenses and produce a metric, along with a bar graph that automatically surfaces how much they’ve spent on energy on a monthly basis. When you give them periodic updates or have meetings about other issues, you can quickly show them where they are in relation to their energy consumption goals, too.
Use Your Industry Knowledge and Business Acumen to Design Optimal Dashboards
The value of your experience with other companies within your client’s industry—as well as your general business smarts—cannot be overstated. You can parlay this knowledge into the kind of comprehensive accounting dashboard you need to guide your client to the next level.
For example, suppose you’re familiar with the restaurant industry and understand the ratios that signify a top-performing food establishment. For example, you may set up your dashboard to display real-time numbers representing:
➤ Gross profit
➤ Profit margin
➤ Sales per square foot
➤ Current ratio
➤ Revenue per seat
And don’t be shy: There’s no harm in showing your client this isn’t your first rodeo—that you’re willing to invest both your time and experience to leverage the best accounting data analytics software for the benefit of their business. (learn more about Cloud Accounting)
Start Customizing Your Dashboards with PathQuest BI
PathQuest BI makes it easy to set up the perfect performance dashboard for your client. With PathQuest reporting features, you can make dashboards that support your client’s goals and let you use your business acumen to support their success. To see how PathQuest BI’s customizable dashboards work, sign up for a demo today.
Contact Us

Call Now:
+1 (743) 223-2073


